Maven Invest Portfolios
Investing is simple but certainly not easy.


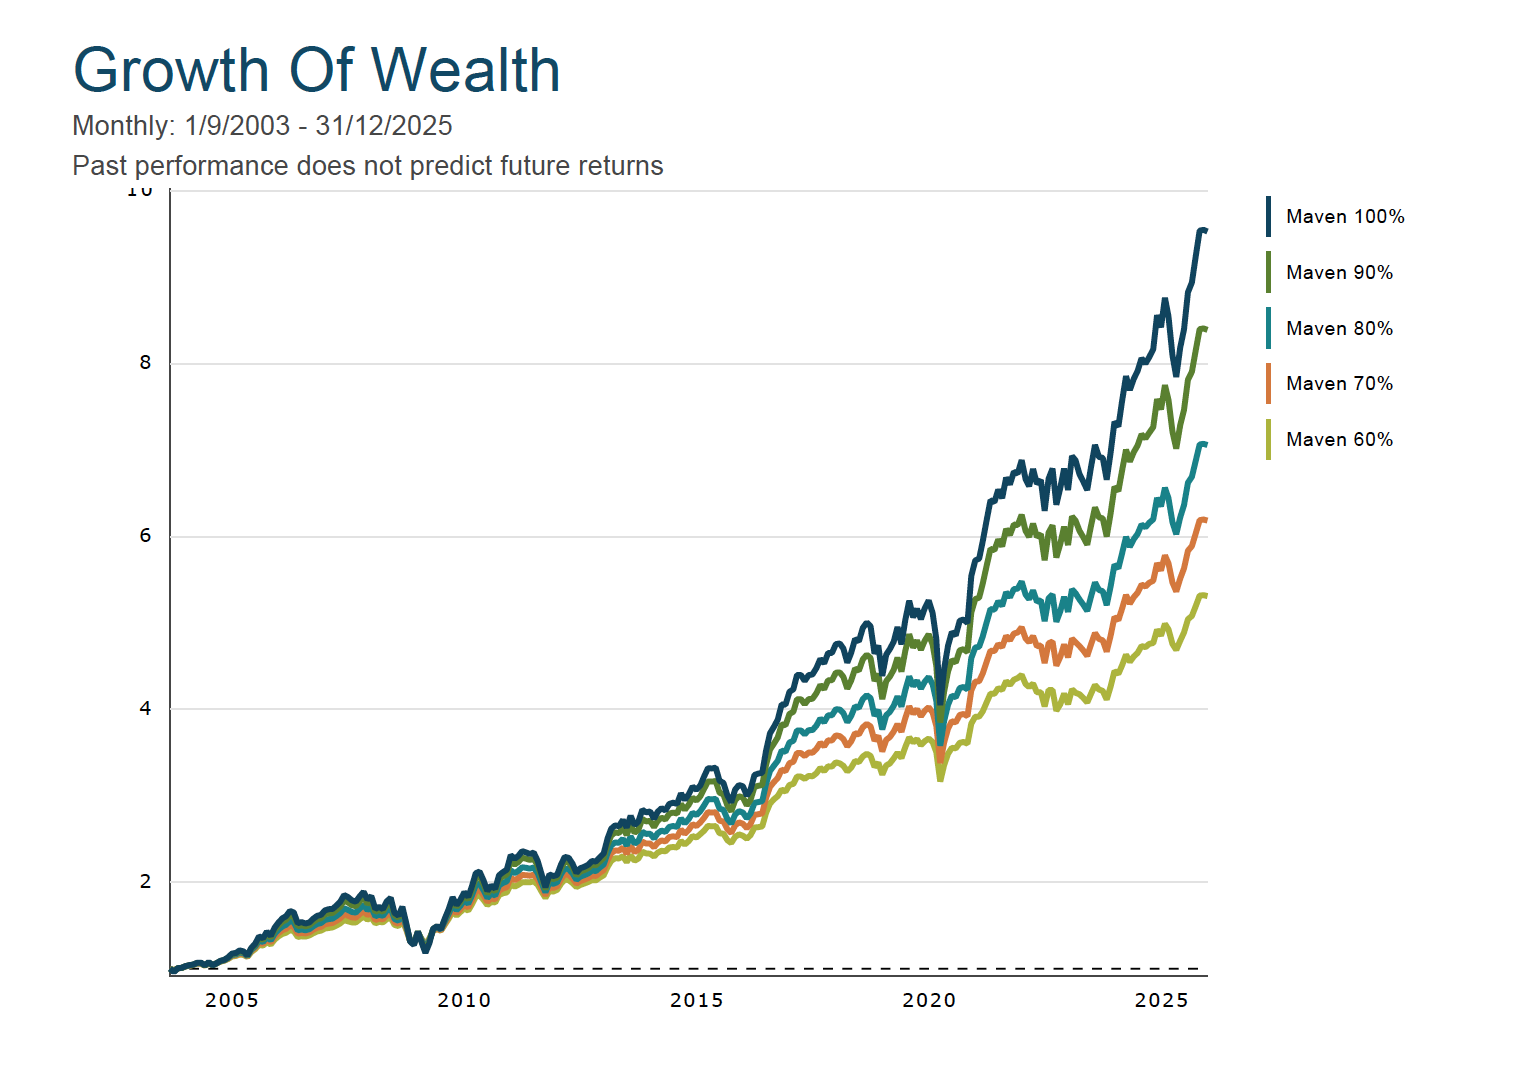
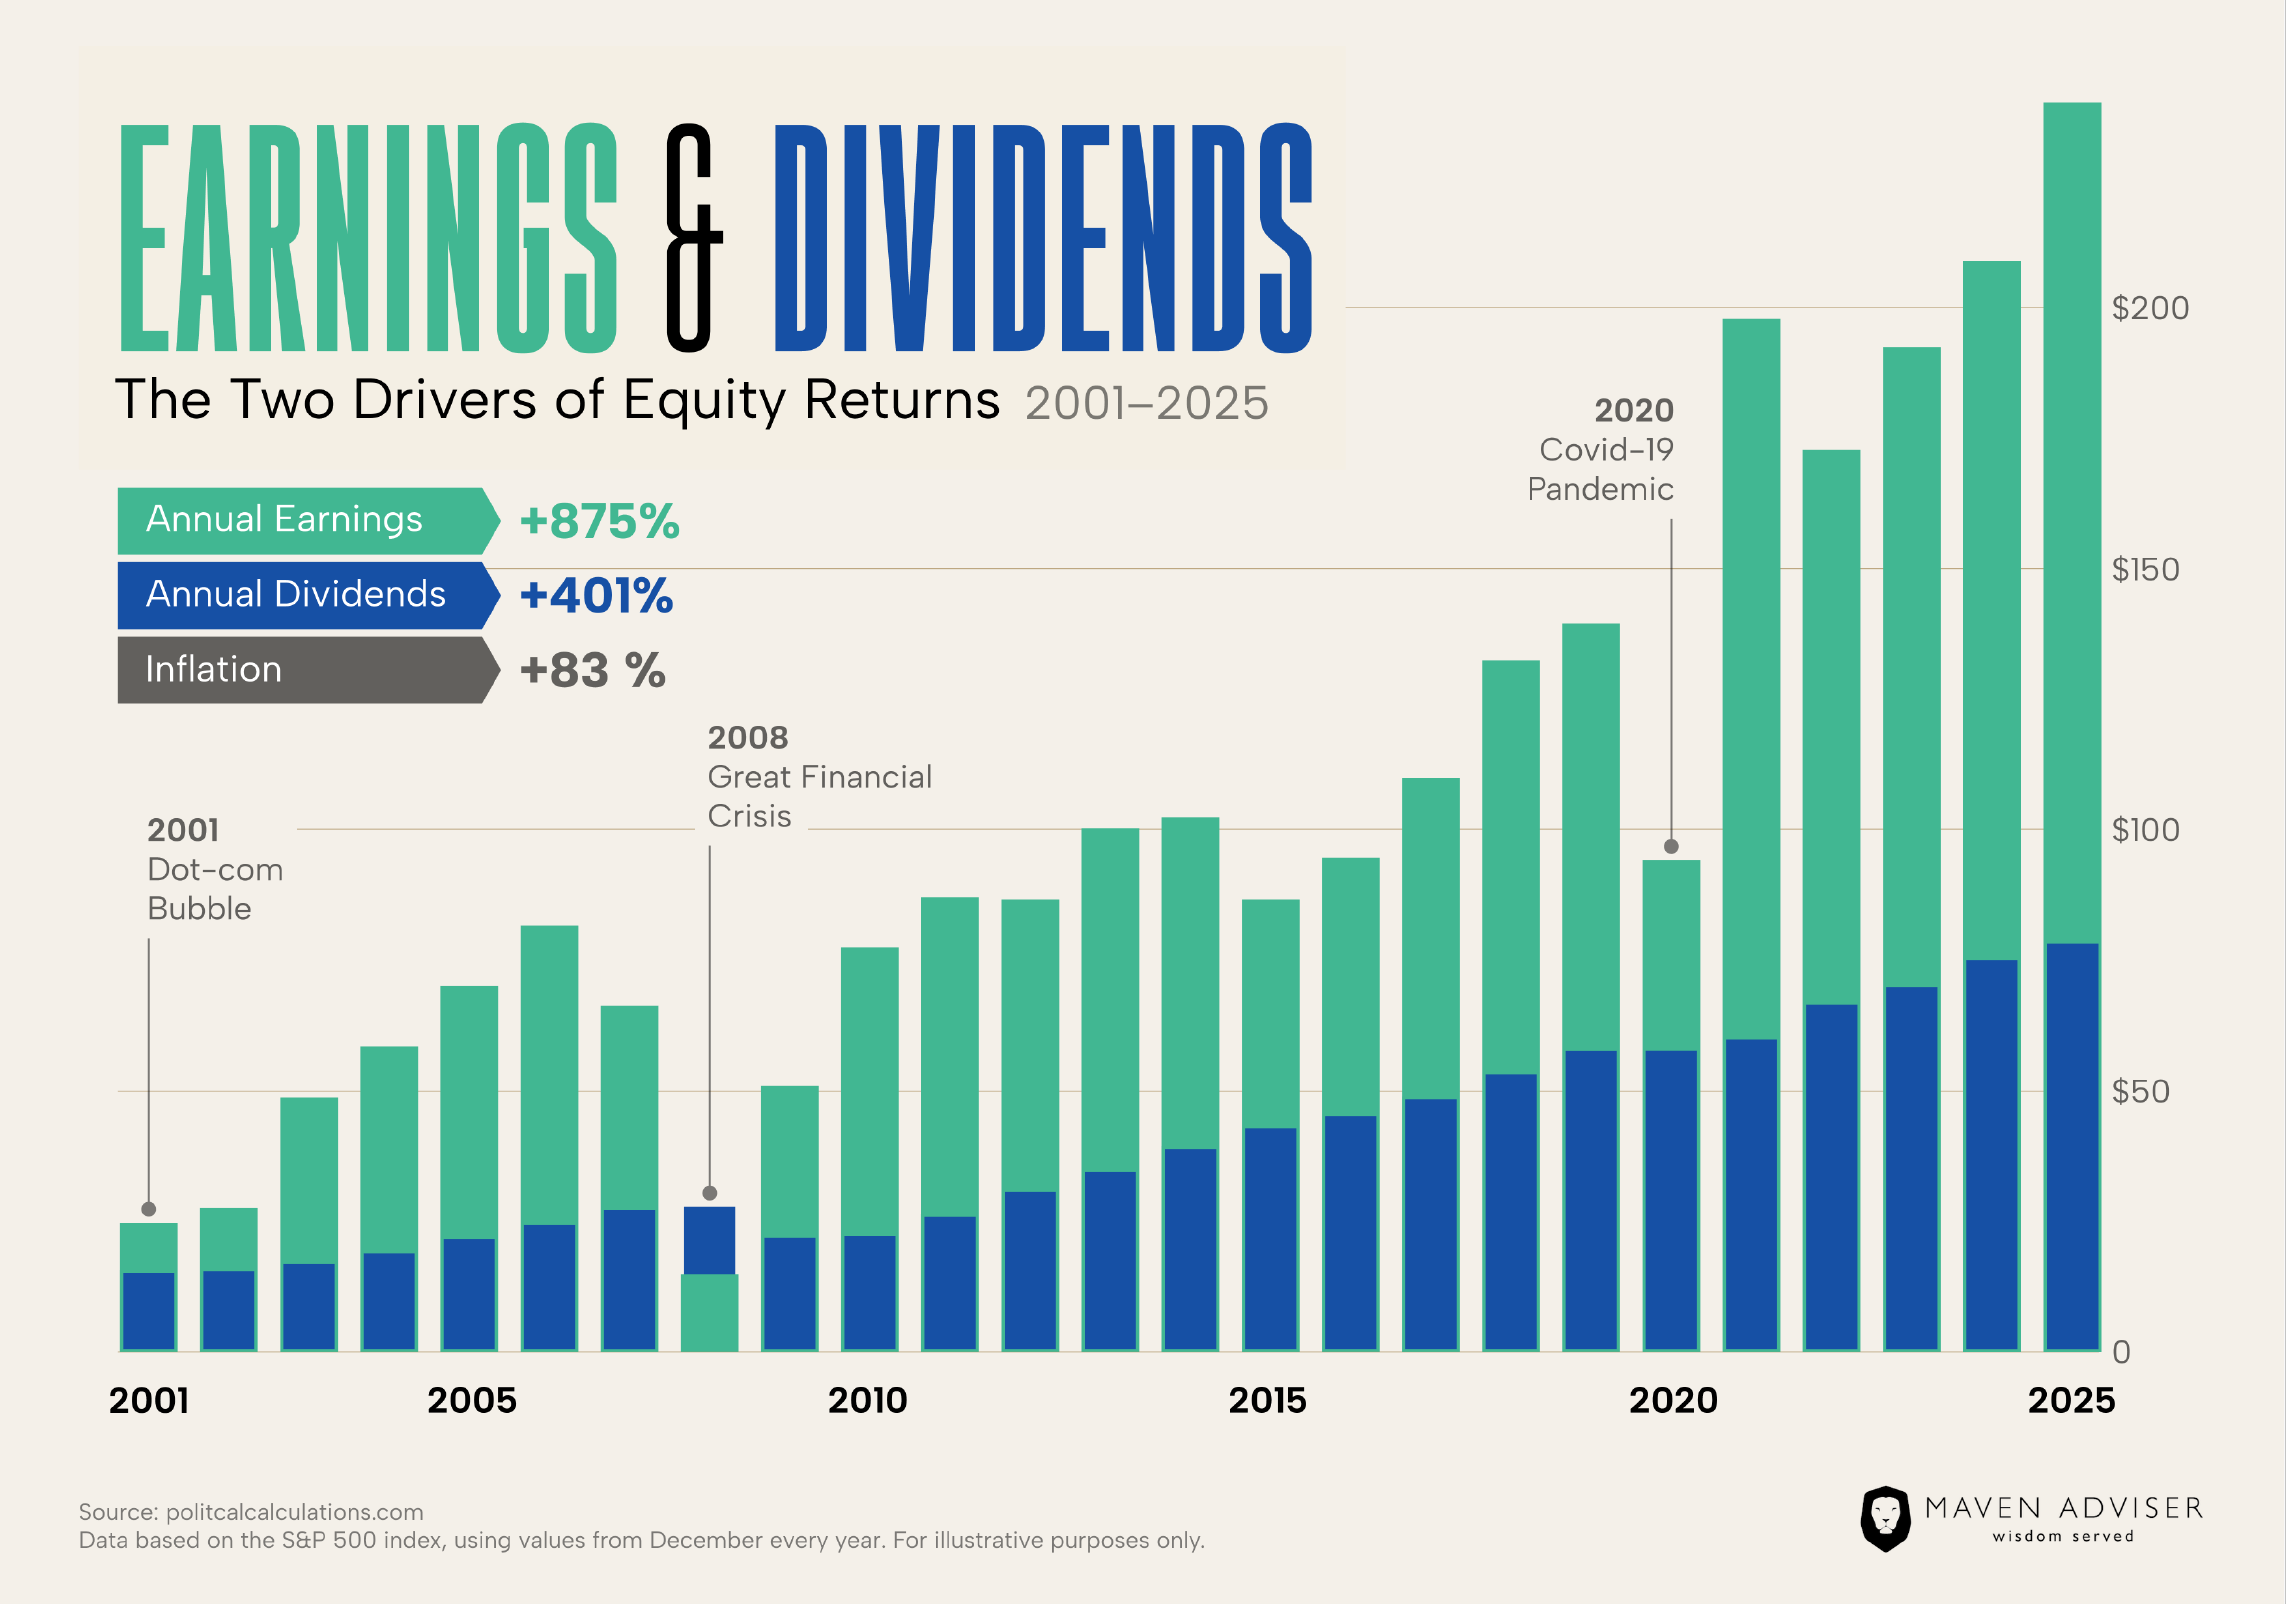
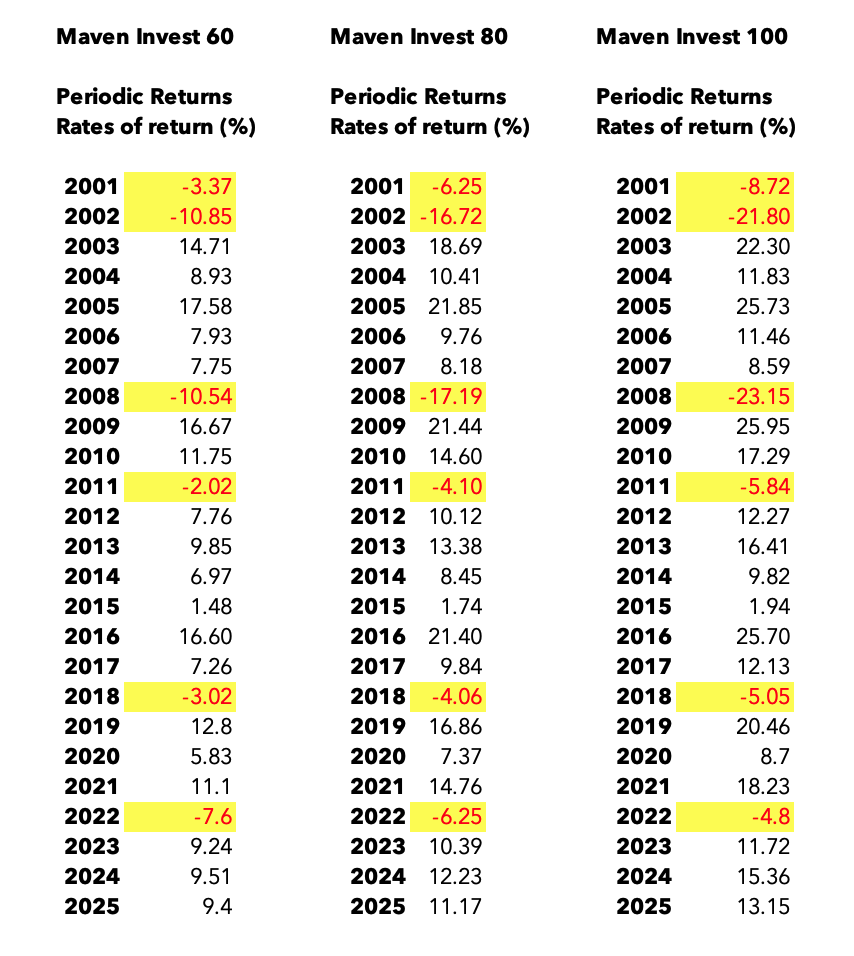
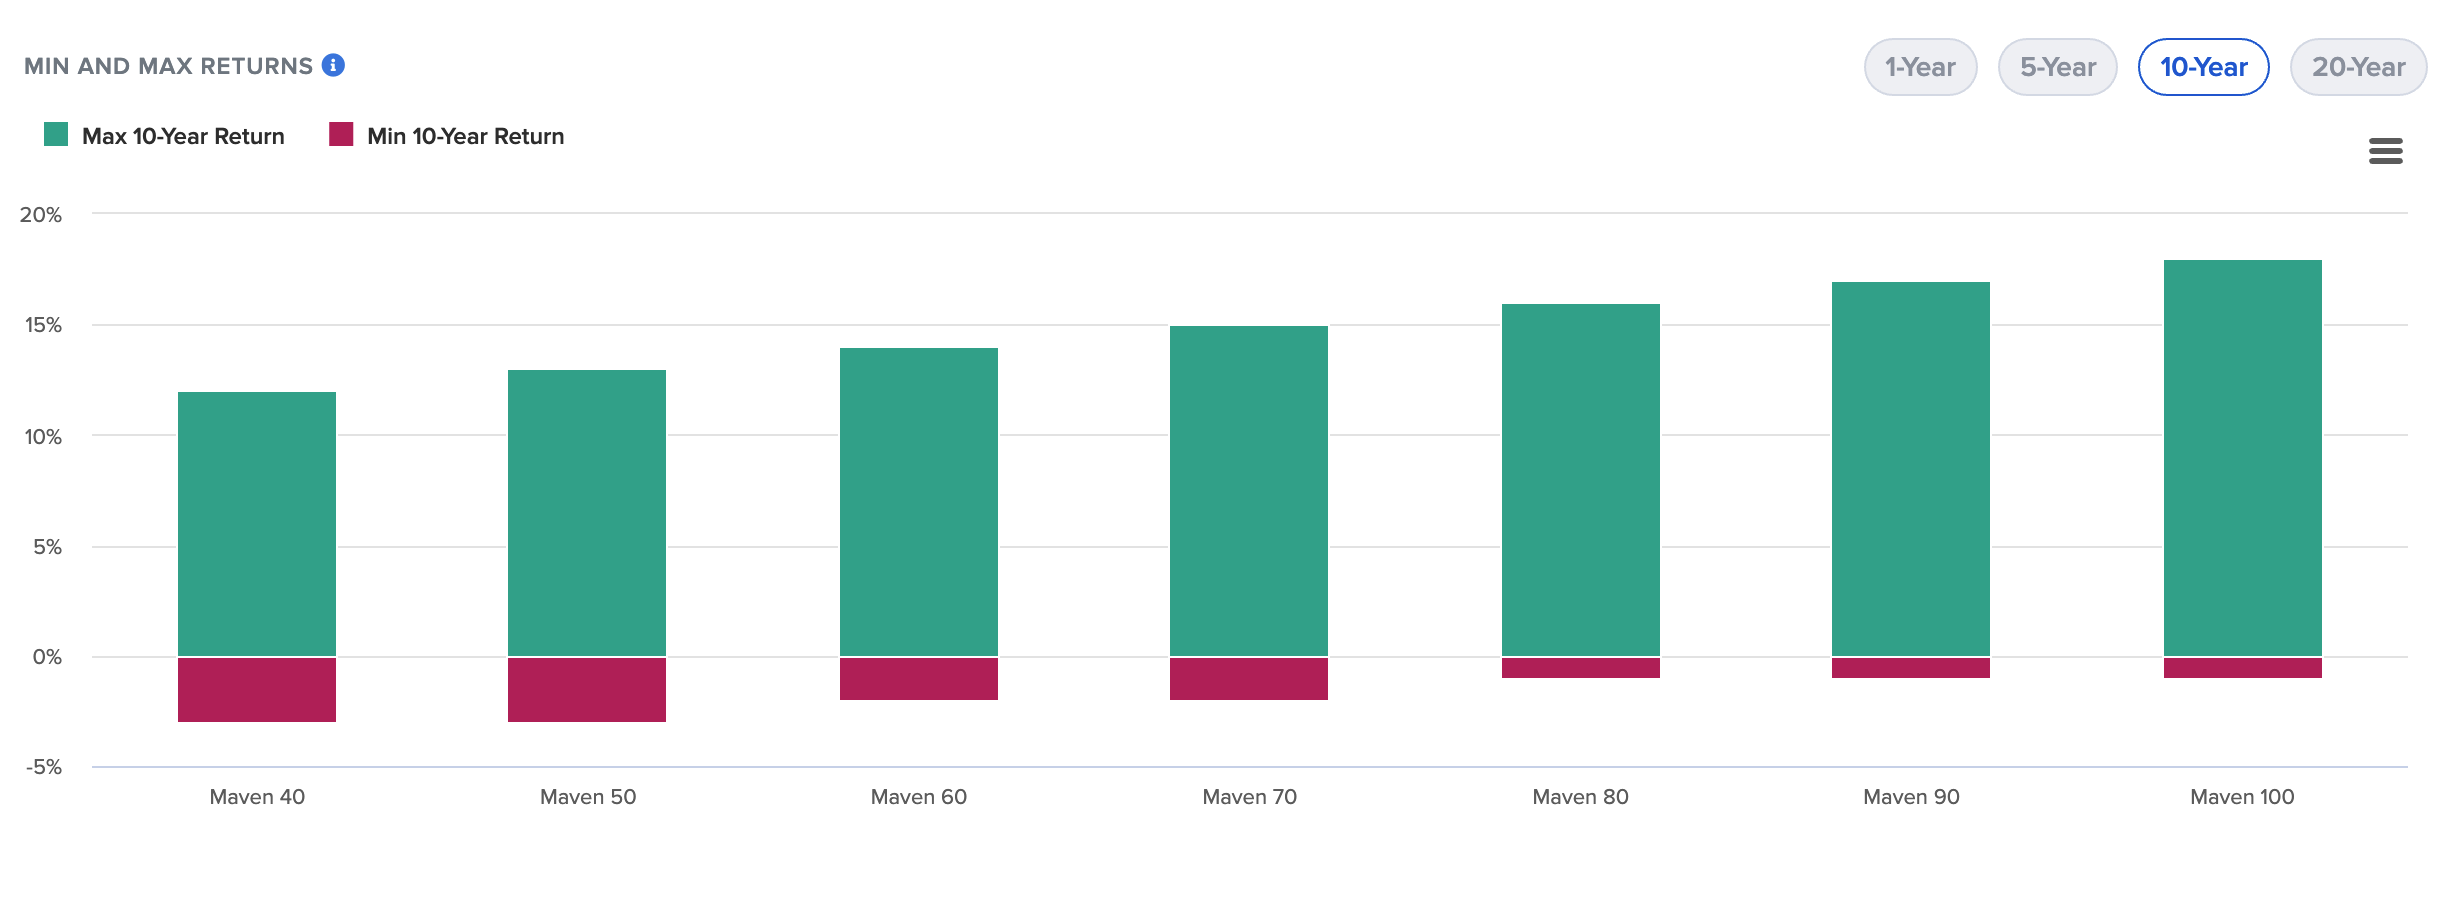
Successful multi-decade investing is simple if you can act with equanimity during all market cycles. Below shows a historical snapshot of the volatility experienced in three of our model portfolios.
[1] Figures for the Maven Invest Model Portfolios only go back to 2017 (due to the date one of our funds was launched). We want to show you figures over a meaningful period of time. The above portfolio is based on the same equity-bond split as your Maven Invest Model Portfolio. It is NOT the same but is a decent proxy.

Investment Lifeboat Drills
S&P500 - Peak to Trough
We have chosen to use the S&P500 to reflect market volatility as it's the largest stock market in the world.
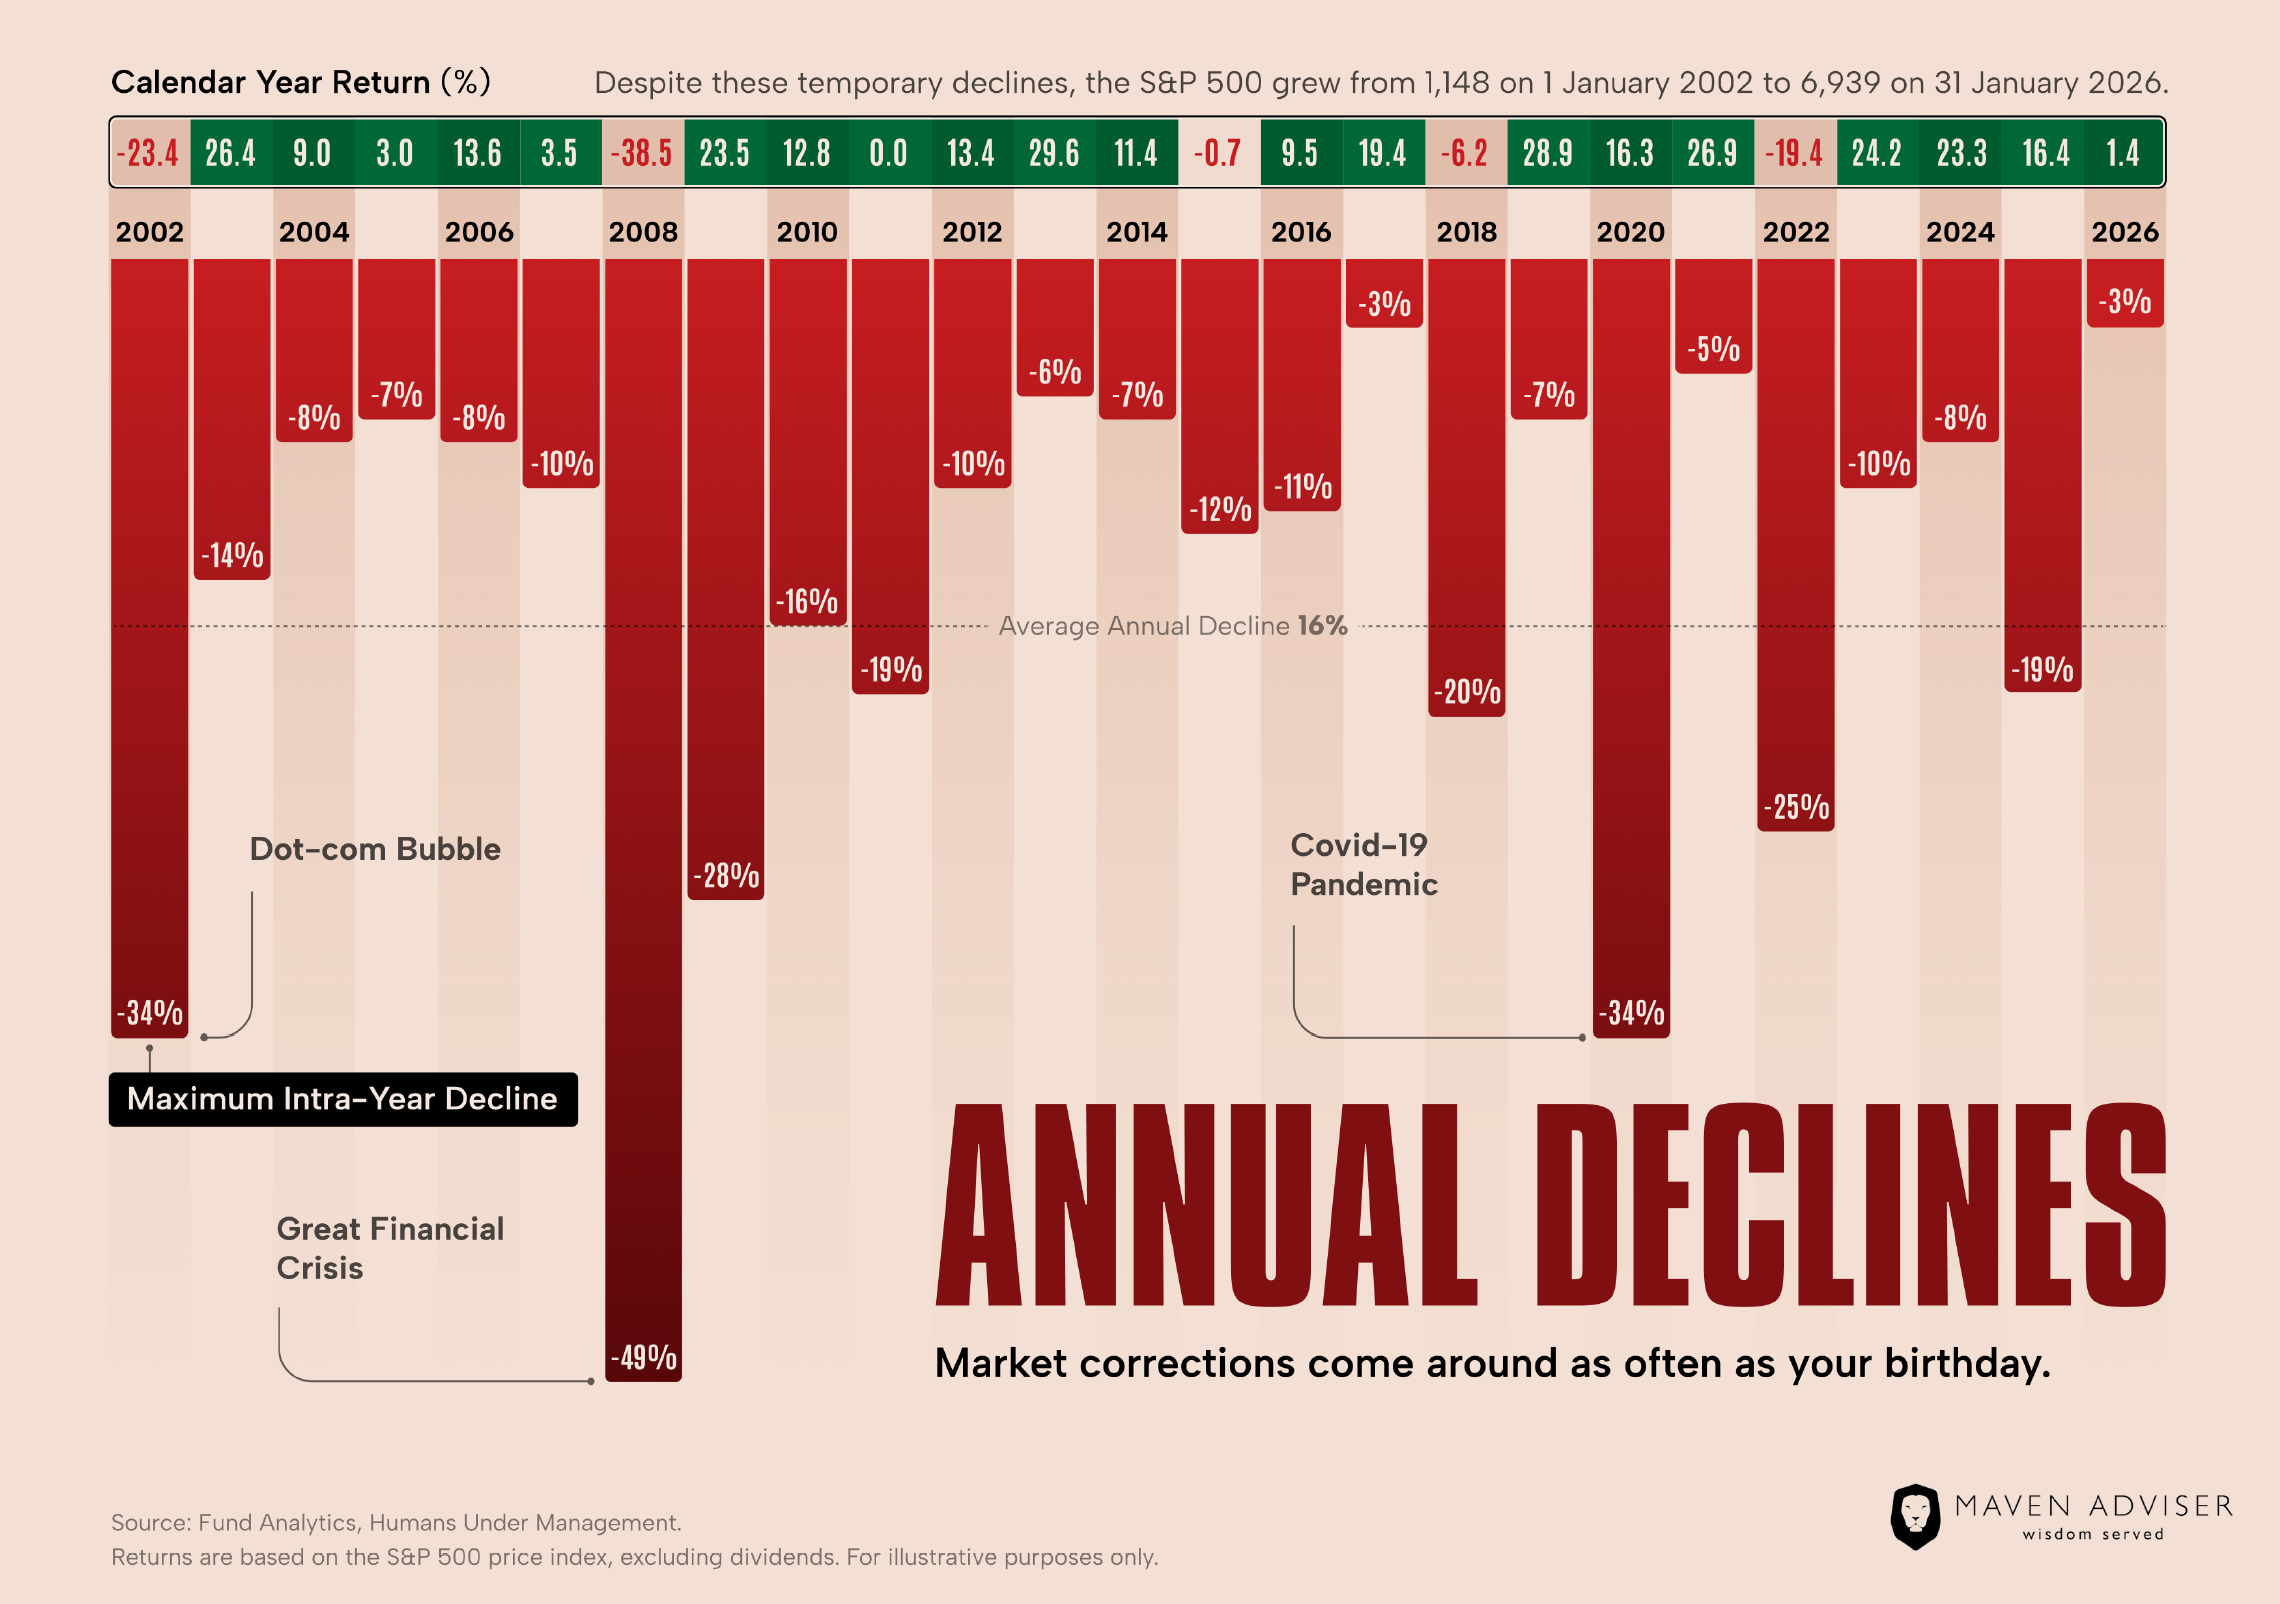
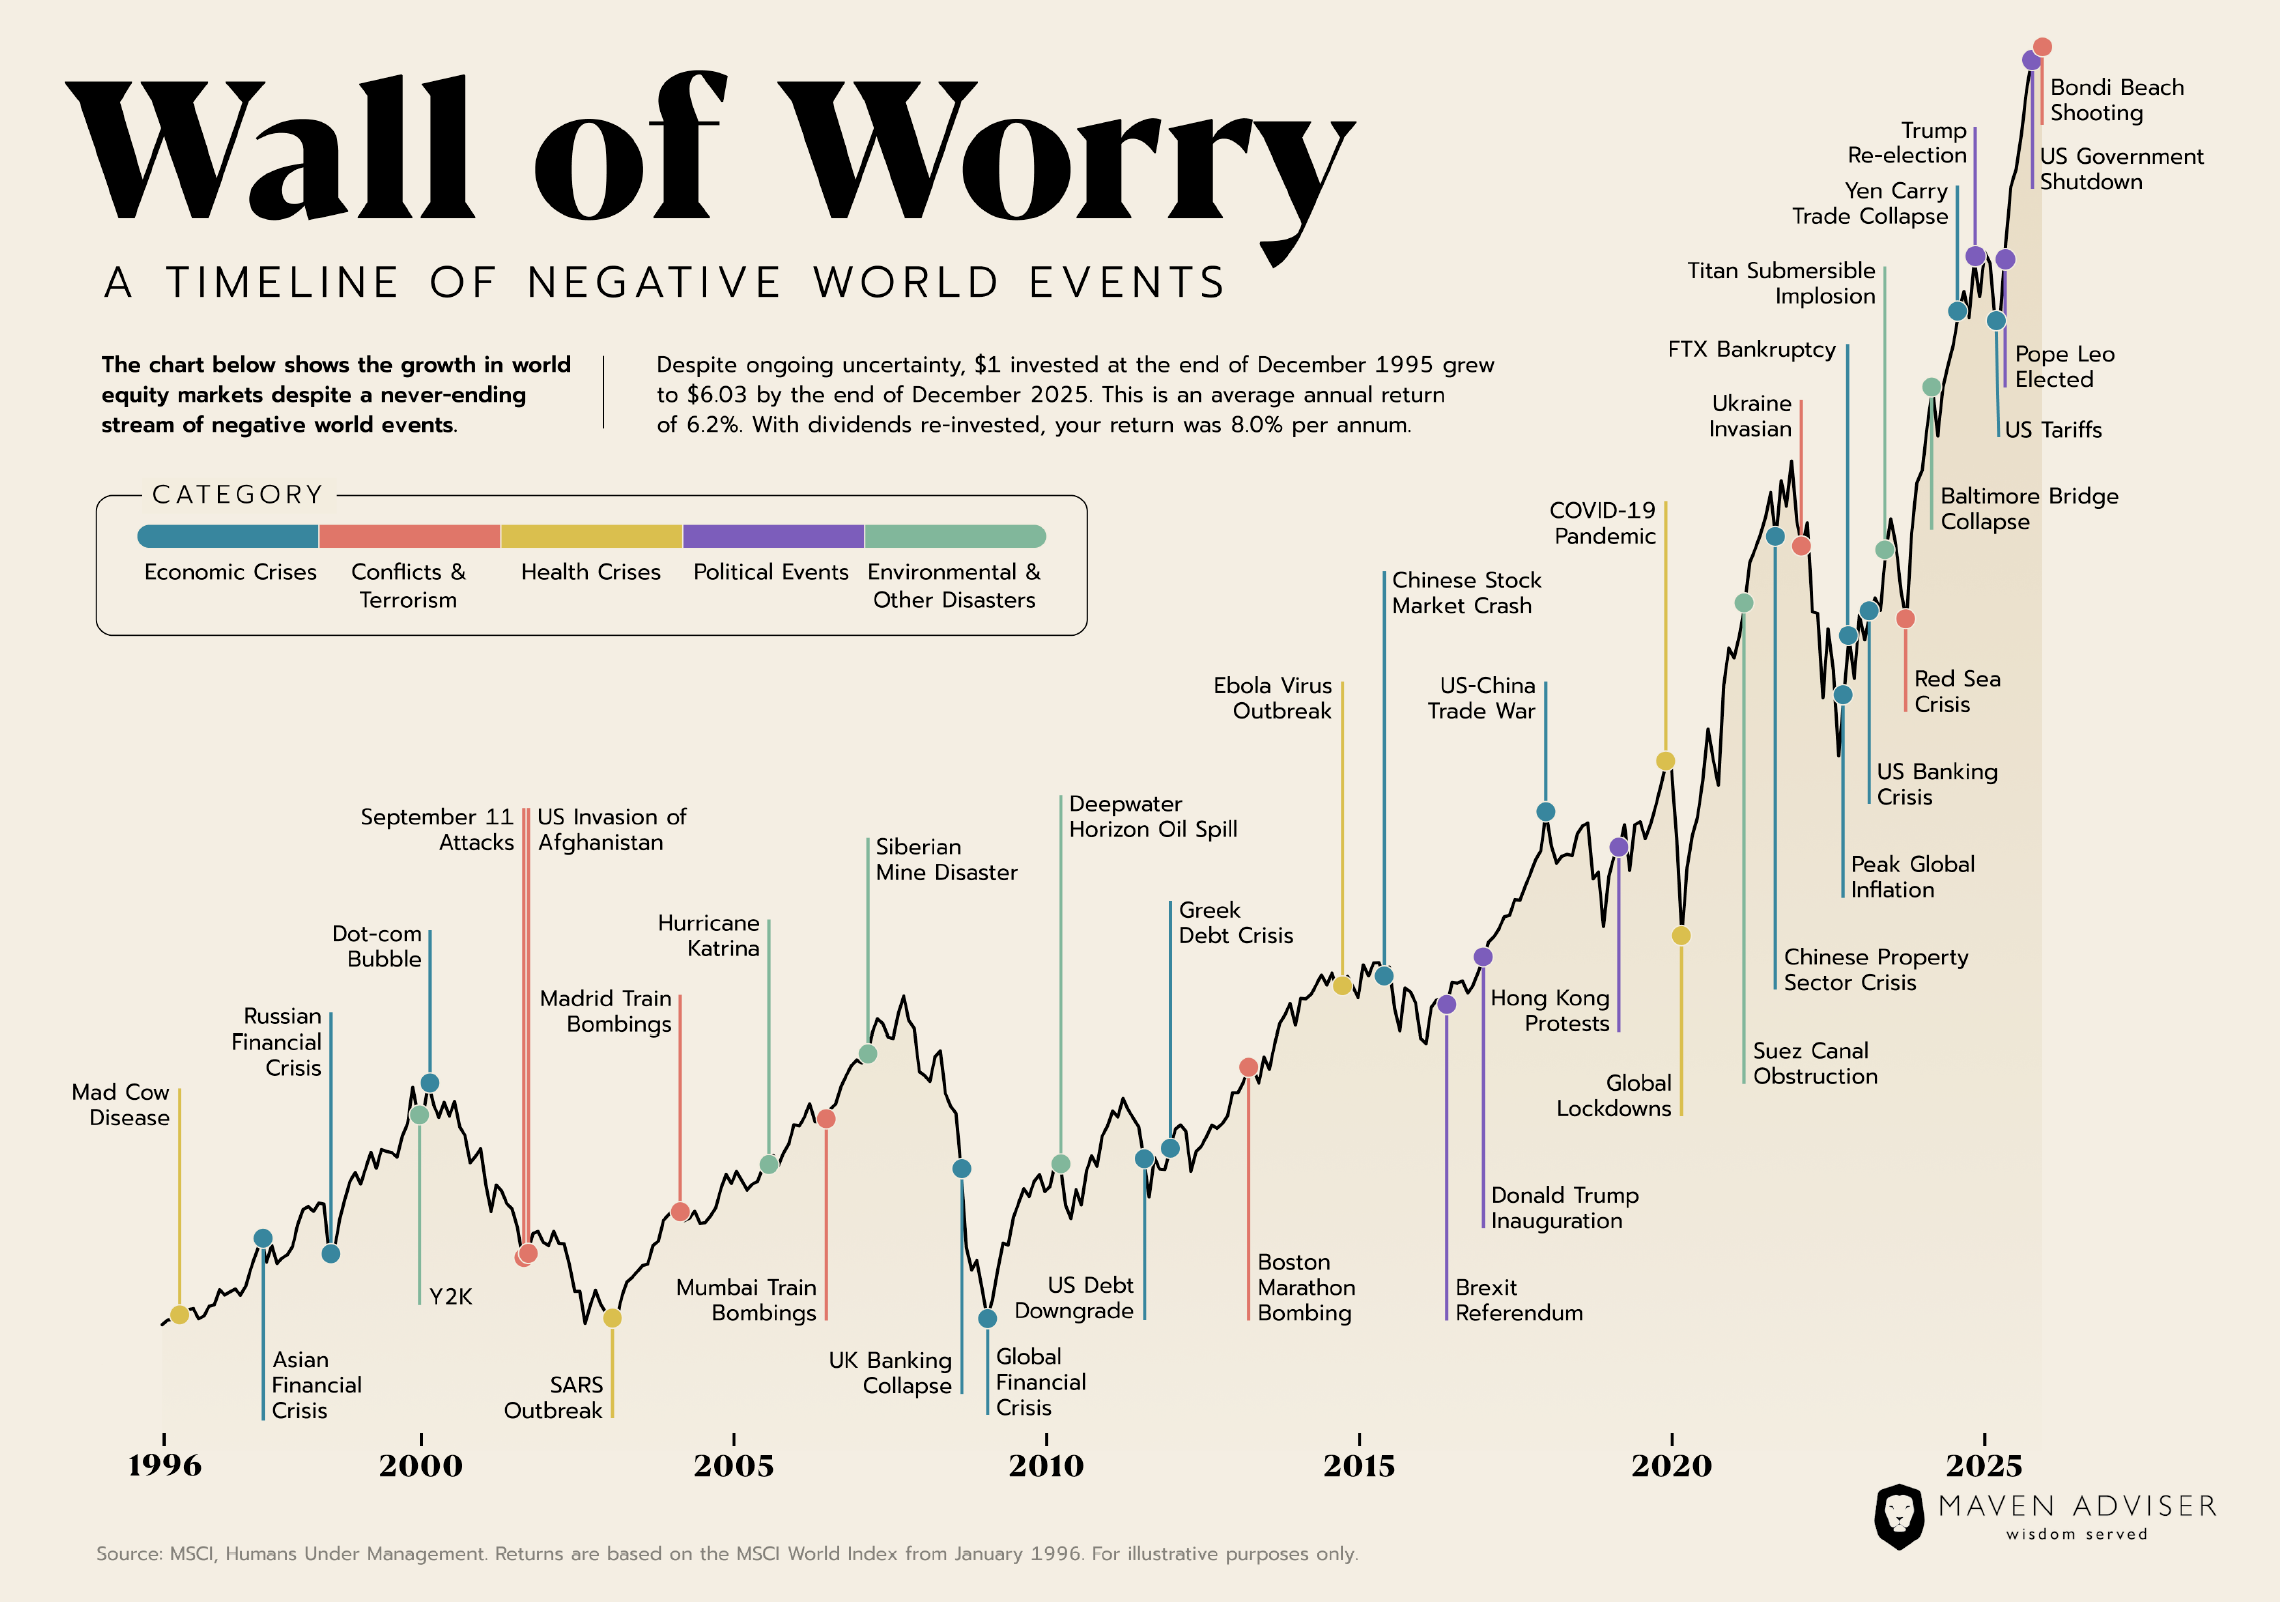
Bear markets cannot be timed or anticipated, they're in effect random. What we can plan against is our reaction to them, which will be to do nothing and ride them out, the only 'strategy' that historically would have worked.
| Dates of Market Peak | Dates of Market Trough | % Return |
Duration | Market Peak | Market Trough |
|---|---|---|---|---|---|
| 05/46 | 06/49 | -30% | 36.5 Months | 19.3 | 13.6 |
| 08/56 | 10/57 | -22% | 14.5 Months | 49.7 | 39.0 |
| 12/61 | 06/62 | -28% | 6.5 Months | 72.6 | 52.3 |
| 02/66 | 10/66 | -22% | 8.0 Months | 94.1 | 73.2 |
| 11/68 | 05/70 | -36% | 18.0 Months | 108.4 | 69.3 |
| 01/73 | 10/74 | -48% | 20.5 Months | 120.2 | 62.3 |
| 09/76 | 03/78 | -19% | 17.5 Months | 107.8 | 86.9 |
| 11/80 | 08/82 | -27% | 20.5 Months | 140.5 | 102.4 |
| 08/87 | 12/87 | -34% | 4.0 Months | 336.8 | 223.9 |
| 07/90 | 10/90 | -20% | 3.0 Months | 369.0 | 295.5 |
| 07/98 | 08/98 | -19% | 1.5 Months | 1186.8 | 957.3 |
| 03/00 | 10/02 | -49% | 30.5 Months | 1527.5 | 776.7 |
| 10/07 | 03/09 | -57% | 17.0 Months | 1565.1 | 676.5 |
| 04/11 | 10/11 | -19% | 5.0 Months | 1363.6 | 1099.2 |
| 09/18 | 12/18 | -20% | 3.0 Months | 2930.8 | 2351.1 |
| 02/20 | 03/20 | -34% | 1.1 Months | 3386.2 | 2237.4 |
S&P 500 price at the end of 2020 - 3756
There's no such thing as an average bear market
Average duration = 13 months
Peak to trough and back approx 40 months
Average decline = -30%